Plotting Software
Advertisement
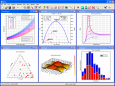
DPLOT95 v.1 3
DPLOT95 is a software for creating and manipulating graphs in 1, 2, 3, and 4-D. With its help you you can create presentation-quality graphs as well as contour plots of 3-D and 4-D data while using data from a variety of sources.
Advertisement
EasyGraph v.1.0
Easy to Use Data Plotting Application. EasyGraph finally provides a simple, intuitive and fast way for students to learn the art of graph creation, modification and data representation.
Quiz Me! v.1.0
Test your knowledge with this simple quiz program. Quiz Me! is a small but extensible quiz software that can include images and choice questions that require either single or multiple answers. Two question sets are provided,
Creatures! v.1.2
An intuitive, interactive, and immersive food chain simulator. Creatures! is a fun, real-time simulator that allows students to learn the underlying principles of population dynamics. Creatures! recreates a world filled with three types of organisms:
DPlot
DPlot is a general purpose graphing program designed for scientists, engineers, and students. It features multiple scaling types, including linear, logarithmic, and probability scales, as well as several special purpose XY graphs and contour plots of 3D
GraphSoftware
This graph tool allows you to make a graph by importing data from various data sources like excel, csv, oracle, mssql, access. you can modify the graphs with a built in canvas. Save the graphs in png,jpg,pdf format.Generate one click graph later by saving
IDC - Imray Digital Charts v.1.0
This Digital Chart covers the following chart areas: C1, C8, C23, C24, C25, C26, C27, C28, C29, C30, C68, Y9, Y16, Y17, Y18, 2000.3, 2000.6, 2000.7, 2100.2, 2100.4, 2100.6.
C v.9.0
This graph tool allows you to make a graph by importing data from various data sources like excel, csv, oracle, mssql, access. you can modify the graphs with a built in canvas. Save the graphs in png,jpg,pdf format.
SimplexParser v.3 1
SimplexParser is used to get the most out of Formula Parsing. With it, you can evaluate mathematical formulas, draw graphs and program with very simple VBScript. SimplexParser is a sophisticated calculation application.
Bell Curve v.1.0
Introduce senior students to the Normal Curve. Bell Curve serves to introduce senior students to the Normal Curve.
MagicPlot Student v.2.3
MagicPlot is an easy to use program for scientific and engineering data analysis, graphing and nonlinear curve fitting. MagicPlot provides publication-quality graphs. It is fast, lightweight and does not need installation.